Top Ecommerce Metrics and KPIs to Track for Business Success [2024]
Unlock ecommerce success by tracking the right metrics and KPIs. Discover how practical insights can optimize performance, boost growth, and enhance customer experience.
Unlock ecommerce success by tracking the right metrics and KPIs. Discover how practical insights can optimize performance, boost growth, and enhance customer experience.

You’ve just built your sparkling new website from a reputable web agency, how do you leverage data to help you with making better decisions? In the competitive world of ecommerce, tracking the right metrics and Key Performance Indicators (KPIs) isn’t just a nice-to-have—it’s the backbone of a successful business strategy. The data you collect from these metrics holds the answers to critical questions: Are your efforts converting visitors into buyers? Which products drive the most revenue? How effectively are you managing your inventory? Without these insights, businesses risk relying on guesswork rather than insightful decisions.
Yet, not all metrics are created equal. Focusing on vanity metrics like website traffic or social media likes without connecting them to business outcomes can lead to wasted resources. Instead, it’s essential to prioritize ecommerce performance metrics that reveal the true health of your operations and help you optimize for growth.
This guide dives into the most important ecommerce KPIs and metrics to track, explaining how they work, why they matter, and how to use them to make data-driven decisions. Whether you’re a seasoned seller or just getting started, understanding these metrics will empower you to scale your business effectively while keeping customer experience and profitability front and center.
Before diving into specific metrics, it’s essential to understand what ecommerce metrics and KPIs are and how they differ. Though often used interchangeably, they serve distinct roles in measuring and achieving success in your business.
Ecommerce metrics are quantitative data points that give you insights into various aspects of your business, such as website traffic, sales, and customer behavior. These metrics are your raw performance indicators, telling you what’s happening in your ecommerce ecosystem. For example:
However, not all metrics are equally useful. Metrics like page views or social media followers, while easy to measure, often fail to tie directly to revenue. These are commonly referred to as “vanity metrics” because they don’t provide actionable insights into your business’s bottom line.
Key Performance Indicators (KPIs) are the critical metrics that directly align with your business goals. Unlike general metrics, KPIs are goal-specific and tied to outcomes that impact your bottom line. For example:
Think of KPIs as the compass that keeps your business strategy on track. While metrics provide the “what,” KPIs give the “why” and “how” to evaluate your progress toward success.

Tracking the right ecommerce metrics and KPIs allows you to:
By focusing on actionable ecommerce KPIs, you can create a streamlined path to growth while avoiding the pitfalls of scattered or irrelevant data.
Pro Tip: Use tools like OneCart to automate KPI tracking and gain real-time insights into your ecommerce performance across multiple channels.

To effectively manage and grow your ecommerce business, it’s crucial to focus on metrics that provide actionable insights. Here are the essential ecommerce metrics you need to monitor to optimize performance, drive revenue, and create a seamless shopping experience for your customers.
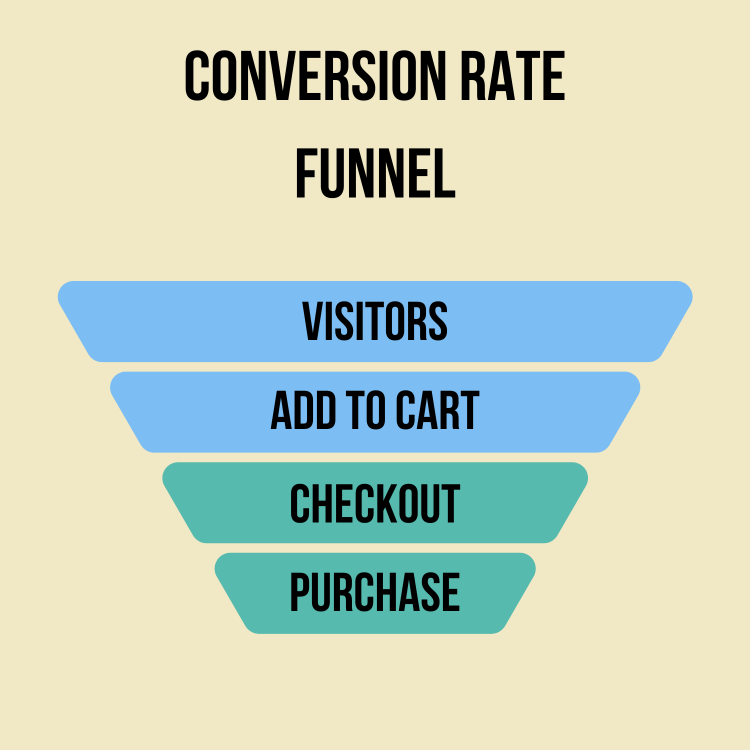
What It Measures: The percentage of visitors who complete a desired action, such as making a purchase.
Formula:
(Number of Conversions ÷ Total Visitors) × 100
Why It Matters:
Conversion rate reveals how well your website turns visitors into paying customers. A low conversion rate could indicate issues with your site’s user experience, pricing, or trustworthiness. This metric is a cornerstone for evaluating the success of your sales funnel.
Pro Tip: Improve conversion rates by simplifying your checkout process, offering free shipping, and building trust with user reviews or secure payment badges.
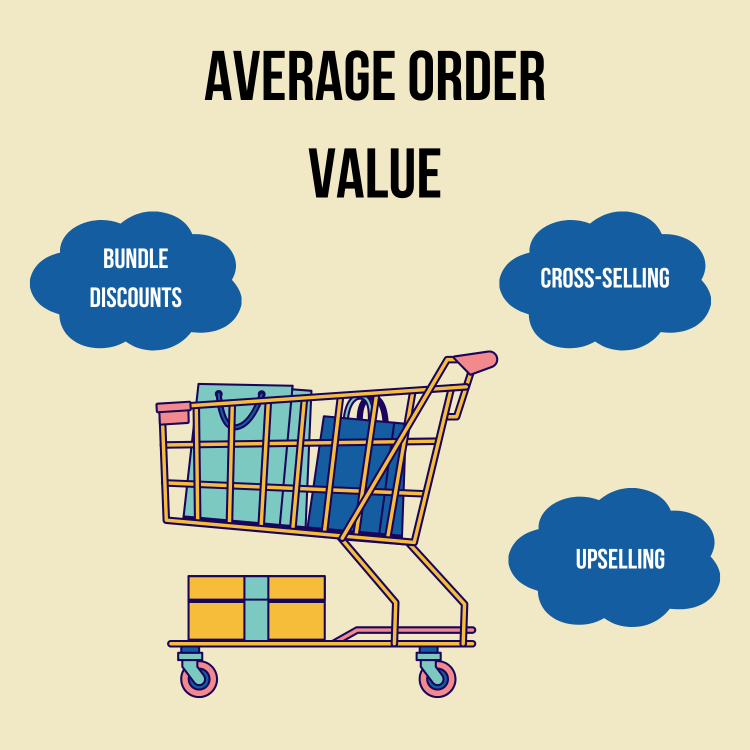
What It Measures: The average amount spent per order.
Formula:
Total Revenue ÷ Total Orders
Why It Matters:
Increasing AOV directly boosts revenue without requiring additional customers. By encouraging shoppers to spend more per transaction, you maximize the value of each visit.
Pro Tip: Increase AOV by bundling products, offering tiered discounts (“Spend $50, get 10% off”), or showcasing complementary products during checkout.
What It Measures: The percentage of shoppers who add items to their cart but fail to complete the purchase.
Formula:
(Number of Abandoned Carts ÷ Total Initiated Checkouts) × 100
Why It Matters:
High cart abandonment rates signal friction points in the buying process, such as unexpected costs, lack of payment options, or a lengthy checkout.
Pro Tip: Reduce abandonment with retargeting emails, transparent pricing, and offering a guest checkout option to remove barriers.

What It Measures: The cost of acquiring a new customer through marketing and advertising efforts.
Formula:
Total Marketing Spend ÷ Number of New Customers Acquired
Why It Matters:
CAC highlights the efficiency of your marketing campaigns. A high CAC may indicate the need for better targeting or channel optimization, while a low CAC reflects strong ROI.
Pro Tip: Pair CAC with Customer Lifetime Value (CLV) to assess long-term profitability. Aim to keep CAC below your CLV for sustainable growth.
What It Measures: The total revenue you can expect from a customer over their entire relationship with your brand.
Formula:
Average Purchase Value × Purchase Frequency × Customer Lifespan
Why It Matters:
CLV helps you understand the long-term value of retaining customers. Businesses with high CLV often enjoy higher profitability due to recurring revenue and reduced acquisition costs.
Pro Tip: Increase CLV with loyalty programs, personalized marketing, and exceptional post-purchase support to keep customers coming back.
What It Measures: The revenue generated for every dollar spent on advertising.
Formula:
Revenue from Ads ÷ Ad Spend
Why It Matters:
ROAS shows the effectiveness of your advertising efforts, helping you determine which campaigns and channels deliver the best results.
Pro Tip: Focus on high-ROAS channels and continually optimize underperforming campaigns to improve ad spend efficiency.
While the essential metrics provide a foundation for understanding your ecommerce performance, advanced metrics offer deeper insights into your operations and customer behavior. These metrics help you fine-tune strategies, improve efficiency, and uncover opportunities for growth.
What It Measures: How quickly your inventory is sold and replaced over a specific period.
Formula:
Cost of Goods Sold (COGS) ÷ Average Inventory
Why It Matters:
A high inventory turnover rate indicates efficient stock management and strong product demand, while a low rate may point to overstocking or slow-moving items.
Pro Tip: Use tools like OneCart to monitor inventory levels in real-time and prevent stockouts or overstocking by integrating demand forecasting.

What It Measures: The percentage of customers who make multiple purchases.
Formula:
(Number of Repeat Customers ÷ Total Customers) × 100
Why It Matters:
A high repeat purchase rate signals strong customer loyalty and satisfaction, reducing the need for costly acquisition campaigns.
Pro Tip: Increase repeat purchases with targeted email campaigns, exclusive discounts for returning customers, and loyalty programs.
What It Measures: The percentage of revenue that remains after subtracting the cost of goods sold.
Formula:
(Revenue - COGS) ÷ Revenue × 100
Why It Matters:
Gross profit margin reveals the profitability of your products. A declining margin may indicate rising costs or the need for pricing adjustments.
Pro Tip: Regularly review pricing and negotiate with suppliers to maintain healthy margins.
What It Measures: The performance of different sales channels (e.g., website, marketplaces, social media).
Why It Matters:
Understanding sales by channel helps you identify where to allocate resources for maximum ROI. For example, if TikTok Shop consistently outperforms other channels, you can focus marketing efforts there.
Pro Tip: Use a centralized tool like OneCart to track sales across multiple platforms and streamline operations. Need more tips on order management? Read our article here.
What It Measures: Customer satisfaction and likelihood to recommend your brand.
Formula:
Percentage of Promoters - Percentage of Detractors
Why It Matters:
A high NPS reflects strong customer loyalty, while a low score signals potential issues in your customer experience.
Pro Tip: Use NPS surveys to gather actionable feedback and prioritize improvements in your shopping experience.
What It Measures: The percentage of customers retained over a specific period.
Formula:
((Customers at End of Period - New Customers) ÷ Customers at Start of Period) × 100
Why It Matters:
Retention is more cost-effective than acquisition. This metric shows how well you’re maintaining relationships with your customers.
Pro Tip: Focus on retention strategies such as personalized marketing, faster delivery options, and responsive customer service.
Tracking ecommerce metrics is only part of the equation. To drive meaningful results, you need a system for measuring success and connecting your metrics to actionable goals. Here’s how you can measure ecommerce success effectively:
Each metric should align with a well-defined business objective. For instance:
Pro Tip: Use the SMART framework—goals should be Specific, Measurable, Achievable, Relevant, and Time-bound.
Managing multiple sales channels and marketing campaigns requires robust tools for data aggregation and analysis. Centralized platforms like OneCart allow you to track metrics across Shopify, Amazon, TikTok Shop, and more in one dashboard.
Benefits of Centralized Tools:
Compare your metrics to industry averages or past performance to gauge success. For example:
Success isn’t just about snapshots; it’s about the bigger picture. Use historical data to identify:
Pro Tip: Visualize trends using graphs and charts to make them easier to interpret and present to stakeholders.
Metrics are most powerful when viewed together. For example:
Manual tracking is time-consuming and prone to errors. Use automation tools to:
Platforms like OneCart make it simple to automate these processes, saving time and ensuring accuracy.
Metrics aren’t static. Regularly review your KPIs to ensure they remain aligned with your goals and market conditions. Create a monthly or quarterly review process to:
Pro Tip: Focus on incremental improvements rather than sweeping changes to avoid disrupting your operations.
Customer experience (CX) is a pivotal aspect of ecommerce success. A seamless shopping journey not only increases conversions but also builds long-term customer loyalty. Here are the key CX metrics you should track to enhance your ecommerce business:
What It Measures:
The likelihood that customers will recommend your business to others.
Formula:
(% of Promoters - % of Detractors)
Why It Matters:
A high NPS indicates strong customer satisfaction and loyalty, while a low score highlights areas for improvement.
Pro Tip: Use post-purchase surveys to calculate NPS and gather actionable feedback. Act on common pain points to improve your overall customer journey. Learn more about customer loyalty here.
What It Measures:
The average time it takes for your website to load.
Why It Matters:
Slow-loading pages frustrate users and significantly impact conversion rates. Research shows that a one-second delay in page load time can reduce conversions by 7%.
Pro Tip: Optimize images, enable browser caching, and use a Content Delivery Network (CDN) to improve site speed. Regularly test performance on both desktop and mobile devices.
What It Measures:
The percentage of visitors who leave your website after viewing only one page.
Formula:
(Single-Page Sessions ÷ Total Sessions) × 100
Why It Matters:
A high bounce rate signals that your website isn’t engaging visitors, which could be due to poor design, irrelevant content, or confusing navigation.
Pro Tip: Improve your homepage or landing page design to make it visually appealing and relevant. Include clear calls-to-action (CTAs) that guide users further into your site.
What It Measures:
The percentage of users who add items to their cart but don’t complete the purchase.
Why It Matters:
A high cart abandonment rate indicates friction in the checkout process, such as hidden fees, lack of payment options, or a complicated checkout flow.
Pro Tip: Offer transparent pricing, provide multiple payment options, and enable guest checkout. Use retargeting emails or SMS to remind customers to complete their purchase.
What It Measures:
The average time it takes for your customer service team to respond to inquiries.
Why It Matters:
Quick response times enhance customer satisfaction and demonstrate that you value their time. Delayed responses, on the other hand, can lead to frustration and lost sales.
Pro Tip: Use live chat tools or AI-powered chatbots to provide instant responses. For email or ticket inquiries, aim for a response time under 24 hours.
What It Measures:
Customer satisfaction with the product and overall purchase experience.
Why It Matters:
This metric provides insights into whether your customers are happy with their orders, which directly impacts repeat purchases and word-of-mouth referrals.
Pro Tip: Send post-purchase surveys or follow-up emails to measure satisfaction. Use this feedback to refine your product offerings and fulfillment processes.
What It Measures:
The percentage of purchased items that are returned.
Formula:
(Total Returns ÷ Total Sales) × 100
Why It Matters:
A high return rate can indicate product quality issues, misleading descriptions, or unmet customer expectations.
Pro Tip: Provide accurate product descriptions, high-quality images, and clear sizing guides to reduce returns. Use analytics to identify patterns in returned items and address root causes.
The most critical KPIs depend on your business goals, but common ones include:
The frequency depends on the metric:
Use centralized platforms like OneCart that integrate data from multiple channels into a single dashboard. Automating data collection and reporting ensures accuracy and saves time.
Focus on:
Sales by channel reveal which platforms (e.g., Shopify, Amazon, TikTok Shop) are driving the most revenue. This helps allocate resources effectively and optimize underperforming channels.
Tracking the right ecommerce metrics, like Conversion Rate, CLV, and AOV, is key to optimizing performance and driving growth. Advanced metrics, such as Inventory Turnover Rate and NPS, provide deeper insights into customer behavior and operations. Avoid common pitfalls, focus on actionable KPIs, and leverage tools like OneCart to centralize data and automate reporting. By doing so, you can make smarter decisions, improve customer experience, and achieve sustained growth.
Ready to take control of your ecommerce metrics and simplify your data tracking? Try OneCart today for a 14-day free trial to grow your business!
Automate & Scale Your Online Business with OneCart
Start a Free TrialUsed by hundreds of merchants in Singapore & Southeast Asia