Managing inventory effectively is critical for businesses to stay competitive and meet customer demands. Yet, many struggle with stockouts, overstocking, and poor demand forecasting due to a lack of actionable insights. This is where inventory analytics steps in—a powerful approach that transforms raw data into smarter decisions, optimizing stock levels and boosting operational efficiency. In this guide, we’ll explore the core metrics, tools, and strategies to master inventory analytics and unlock its potential for your business. Whether you’re running a retail store, an eCommerce platform, or a manufacturing operation, this article will show you how to turn inventory management into a key driver of profitability and growth.
Table of Contents
- What is Inventory Analytics?
- Why Inventory Analytics is Crucial
- Core Metrics in Inventory Analytics
- Tools and Techniques for Effective Inventory Analytics
- Real-Life Applications of Inventory Analytics
- Common Challenges in Inventory Analytics and Solutions
- Steps to Implement Inventory Analytics in Your Business
- Frequently Asked Questions (FAQs)
- Summary
What is Inventory Analytics?
Inventory analytics is the systematic approach to analyzing inventory data to gain actionable insights for better decision-making. It leverages metrics, historical trends, and advanced tools to streamline inventory management processes. By identifying patterns and inefficiencies, businesses can forecast demand, prevent stockouts and overstocking, and maintain optimal stock levels.
At its core, inventory analytics transforms raw inventory data into meaningful insights. For example, instead of merely tracking the number of units in stock, it evaluates how fast products are selling, their profitability, and the ideal reorder points. This approach helps businesses make informed decisions, reducing carrying costs and enhancing operational efficiency.
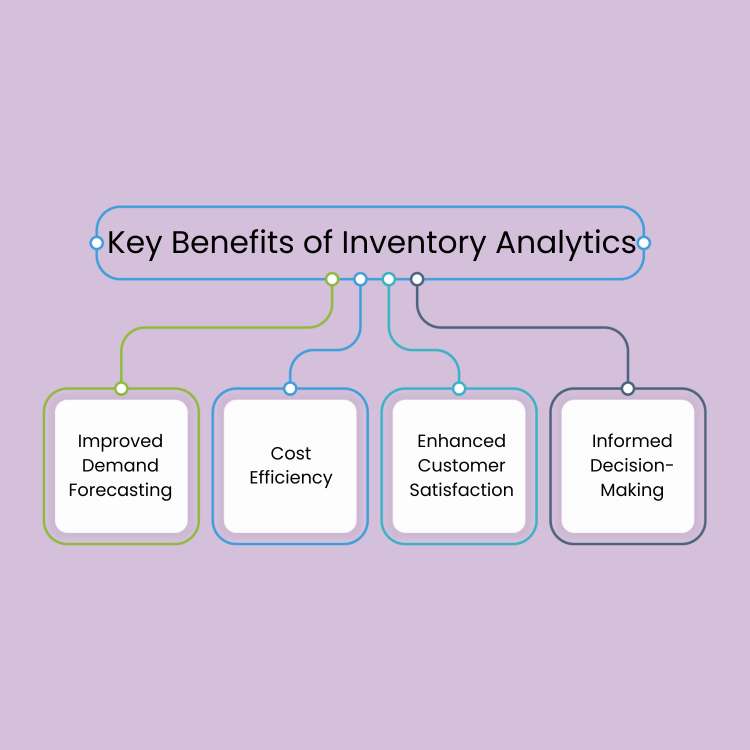
Key Benefits of Inventory Analytics:
- Improved Demand Forecasting: Helps businesses anticipate customer needs and plan inventory levels accordingly.
- Cost Efficiency: Reduces overstocking and storage costs by maintaining appropriate stock levels.
- Enhanced Customer Satisfaction: Ensures product availability, minimizing lost sales due to stockouts.
- Informed Decision-Making: Provides a data-driven foundation for decisions related to procurement, pricing, and inventory replenishment.
In today’s fast-paced market, where customer expectations are high, and competition is fierce, inventory analytics isn’t just an advantage—it’s a necessity. It equips businesses with the tools to stay agile, adapt to market trends, and achieve a seamless balance between supply and demand.
Why Inventory Analytics is Crucial
Inventory analytics is not just a tool; it’s a strategic asset that directly impacts the efficiency and profitability of a business. By leveraging inventory analytics, businesses can address common operational challenges while uncovering opportunities for growth and optimization.
1. Operational Efficiency
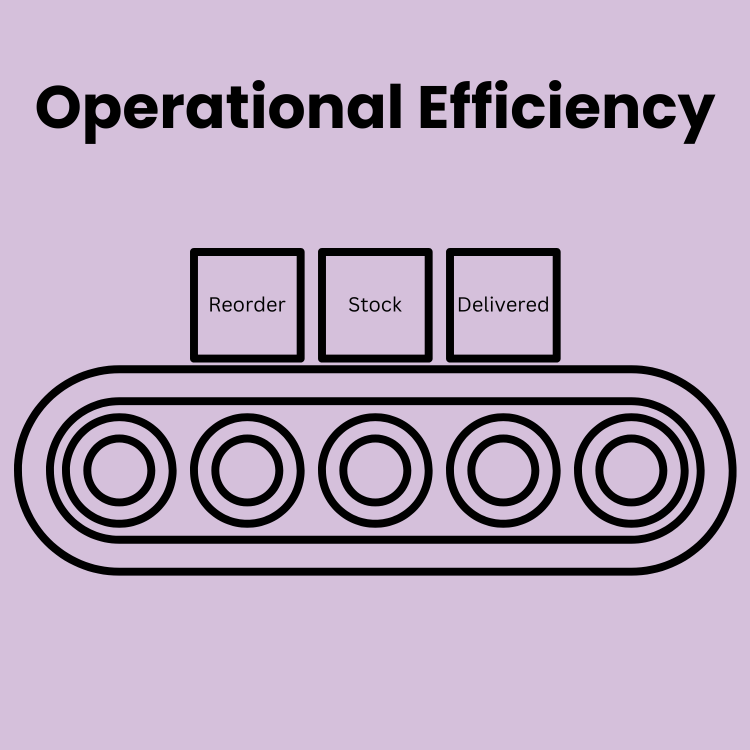
Inventory analytics ensures smoother operations by:
- Reducing Carrying Costs: By analyzing inventory turnover, businesses can avoid overstocking, which ties up capital and incurs storage costs.
- Streamlining Replenishment: Automated insights from inventory data highlight when and how much to reorder, eliminating guesswork.
- Minimizing Stockouts: With accurate demand forecasting, businesses can ensure products are available when customers need them.
2. Improved Decision-Making
Data-driven decisions replace intuition, allowing businesses to:
- Optimize Inventory Levels: Analytics reveals which items are in high demand and which are slow-moving, helping allocate resources efficiently.
- Forecast Demand: By studying historical sales trends, seasonal patterns, and market conditions, businesses can anticipate future needs with precision.
- Enhance Procurement Strategies: Analytics provides clarity on when to negotiate better terms with suppliers based on purchase trends.

3. Aligning with Business Goals
Inventory analytics integrates inventory management with broader business objectives, such as:
- Maximizing Profit Margins: By focusing on profitable SKUs and reducing waste from unsold goods.
- Supporting Multichannel Operations: Analytics ensures consistent stock availability across multiple sales channels, from eCommerce platforms to physical stores.
- Improving Cash Flow: Optimizing inventory reduces overinvestment in unsold stock, freeing up funds for growth initiatives.
Example of Impact
A mid-sized eCommerce business using inventory analytics identifies a trend of higher sales for seasonal products. By forecasting demand and adjusting inventory levels accordingly, the business avoids overstocking during off-peak periods and ensures stock availability during peak demand. The result? Reduced storage costs, fewer missed sales, and higher profitability.
In an era of tight competition and shifting customer preferences, inventory analytics isn’t just important—it’s critical. Businesses that embrace analytics can adapt to market changes, meet customer demands, and achieve long-term growth.
Core Metrics in Inventory Analytics
Effective inventory analytics relies on key metrics that provide valuable insights into inventory performance, stock efficiency, and overall operational health. These metrics allow businesses to track inventory movement, identify inefficiencies, and make informed decisions.
1. Inventory Turnover Ratio
- Definition: Measures how many times inventory is sold and replaced during a specific period.
- Formula: Inventory Turnover Ratio = [Cost of Goods Sold (COGS)] / [Average Inventory]
- Why It Matters:
- A high turnover ratio indicates efficient inventory management and strong sales.
- A low ratio suggests overstocking or slow-moving products.
- Example: A business with $500,000 in COGS and $100,000 in average inventory has a turnover ratio of 5, meaning it replenishes its stock five times a year.
2. Days Sales of Inventory (DSI)
- Definition: Calculates the average number of days it takes to sell inventory.
- Formula: DSI= [Average Inventory / COGS] × 365
- Why It Matters:
- Helps assess the efficiency of inventory usage.
- A lower DSI indicates quicker sales and optimized inventory levels.
- Example: If a company has an average inventory of $50,000 and an annual COGS of $200,000, its DSI is 91.25 days.
3. Gross Margin Return on Investment (GMROI)
- Definition: Evaluates the profitability of inventory investment.
- Formula: GMROI = Gross Margin / Average Inventory Cost
- Why It Matters:
- Indicates how much profit a business makes for every dollar invested in inventory.
- A GMROI greater than 1 means the inventory is generating profit.
- Example: If gross margin is $150,000 and average inventory cost is $50,000, GMROI is 3, meaning $3 is earned for every $1 invested in inventory.
4. Fill Rate
- Definition: Measures the percentage of customer orders fulfilled from stock on hand.
- Formula: Fill Rate = [Orders Fulfilled on Time / Total Orders] × 100
- Why It Matters:
- Reflects customer satisfaction and operational efficiency.
- High fill rates indicate effective inventory management and on-time fulfillment.
5. Backorder Rate
- Definition: Tracks the percentage of orders delayed due to insufficient stock.
- Formula: Backorder Rate = [Backordered Orders / Total Orders] × 100
- Why It Matters:
- Highlights areas where stockouts occur.
- Helps businesses improve their replenishment processes.
6. Stockout Rate
- Definition: Indicates how often products are unavailable when customers want to purchase them.
- Formula: Stockout Rate = [Number of Stockouts / Total Inventory Requests] × 100
- Why It Matters:
- A high stockout rate can damage customer trust and result in lost revenue.
- Encourages businesses to maintain safety stock and optimize inventory forecasting.
How to Use These Metrics
- Strategic Planning: Metrics like turnover ratio and GMROI guide inventory investment decisions.
- Customer Satisfaction: Fill rate and stockout rate ensure product availability and fulfillment speed.
- Operational Efficiency: DSI and backorder rate highlight areas for improvement in stock management and supply chain operations.
Inventory analytics is most effective when paired with the right tools and techniques. These resources empower businesses to gain deeper insights, automate processes, and make data-driven decisions to optimize inventory management.
-
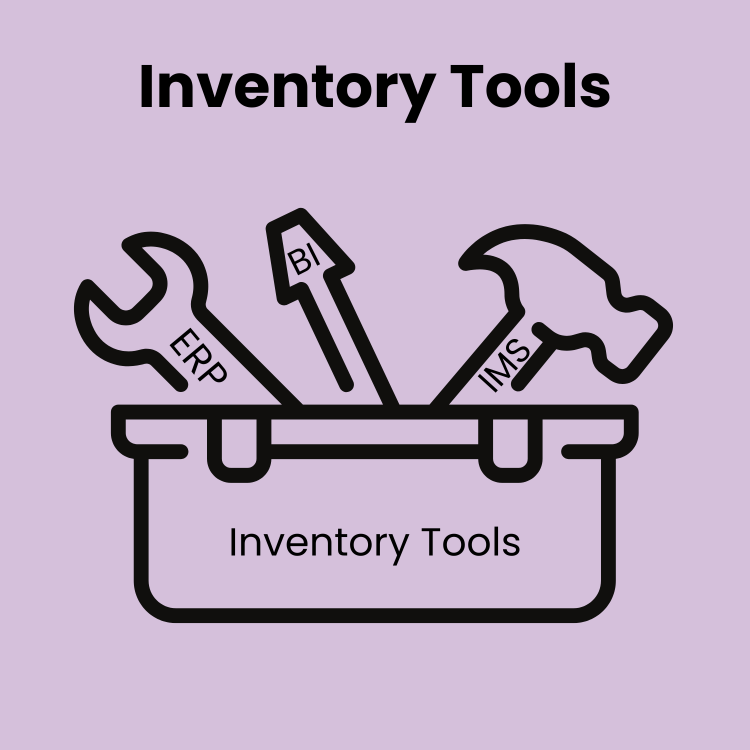
Enterprise Resource Planning (ERP) Systems:
- Integrates various business processes, including inventory management, order tracking, and financial reporting.
- Example: NetSuite, SAP.
-
Inventory Management Software:
- Specialized tools designed to track inventory levels, sales, and stock movement.
- Example: OneCart provides real-time inventory tracking and cross-channel management.
-
Spreadsheet Tools:
- Basic analytics can be performed using Excel or Google Sheets for smaller operations.
- Useful for calculating metrics like turnover ratio and GMROI.
-
Business Intelligence Platforms:
- Advanced analytics and visualization tools to interpret large datasets.
- Example: Tableau, Power BI.
2. Key Techniques for Inventory Analytics
3. The Role of Automation in Inventory Analytics
- Assess Business Needs:
- Identify challenges, such as stockouts, overstocking, or inefficiencies.
- Choose tools that align with specific requirements and scale with business growth.
- Train Teams:
- Provide training to employees to leverage tools effectively.
- Integrate with Existing Systems:
- Ensure compatibility with existing ERP, CRM, or inventory management systems for seamless data flow.
- Monitor and Adjust:
- Regularly review analytics processes to adapt to changing market conditions and business goals.
By combining cutting-edge tools and proven techniques, businesses can unlock the full potential of inventory analytics. These resources enable better forecasting, streamlined operations, and more informed decision-making, paving the way for sustained growth and profitability.
Real-Life Applications of Inventory Analytics
Inventory analytics isn’t just theoretical; it drives tangible results across various industries. By leveraging data insights, businesses can streamline operations, improve customer satisfaction, and increase profitability. Here are real-world applications of inventory analytics and how they benefit businesses.
1. Optimizing Stock Levels
- Use Case: A retail company experiences fluctuating demand for seasonal products, such as holiday decorations or winter apparel.
- How Inventory Analytics Helps:
- Tracks historical sales trends to predict seasonal demand spikes.
- Establishes reorder points to maintain optimal stock levels during peak seasons.
- Prevents overstocking during off-peak times, reducing storage costs.
- Outcome: The business ensures high availability during busy periods while avoiding excess inventory after the season ends.
2. Preventing Stockouts in eCommerce
- Use Case: An eCommerce business selling electronics faces frequent stockouts for popular items like wireless headphones.
- How Inventory Analytics Helps:
- Uses real-time inventory tracking to monitor stock levels across platforms like Shopify, Lazada, and Amazon.
- Implements safety stock strategies based on historical demand and lead times.
- Sets automated alerts to trigger reorders when inventory dips below a predefined threshold.
- Outcome: The company reduces stockouts, enhances customer satisfaction, and retains repeat buyers.
3. Enhancing Inventory Turnover for FMCG
- Use Case: A fast-moving consumer goods (FMCG) manufacturer struggles with slow-moving inventory.
- How Inventory Analytics Helps:
- Identifies underperforming SKUs using turnover ratios.
- Analyzes demand trends to realign production schedules with consumer needs.
- Implements dynamic pricing strategies to clear slow-moving stock.
- Outcome: Improved cash flow and reduced carrying costs by efficiently managing inventory.
4. Supporting Multichannel Operations
- Use Case: A business selling home goods operates on multiple platforms, including a physical store, Shopee, and TikTok Shop.
- How Inventory Analytics Helps:
- Provides centralized inventory management to track stock across all channels.
- Synchronizes inventory updates in real-time to prevent overselling.
- Analyzes sales performance by channel to allocate inventory effectively.
- Outcome: Streamlined operations, reduced discrepancies, and increased sales across channels.
- Use Case: A fashion retailer wants to focus its marketing efforts on its best-selling products.
- How Inventory Analytics Helps:
- Analyzes sales data to identify top-performing SKUs and their contribution to revenue.
- Monitors gross margins to prioritize products with the highest profitability.
- Provides insights into seasonal trends to plan marketing campaigns around high-demand items.
- Outcome: Increased marketing ROI and stronger sales performance.
6. Reducing Deadstock
- Use Case: A business holding obsolete inventory faces high storage costs.
- How Inventory Analytics Helps:
- Identifies deadstock using age-based inventory analysis.
- Recommends markdown strategies or bundle offers to move stagnant items.
- Refines demand forecasting to prevent future overstocking.
- Outcome: Lower storage costs and improved profitability.
Common Challenges in Inventory Analytics and Solutions
Implementing inventory analytics can revolutionize operations, but it’s not without challenges. Businesses often face hurdles related to data accuracy, technology adoption, and cost constraints. Here are some common challenges and actionable solutions to overcome them.

1. Inaccurate Data
- Challenge: Poor data quality, such as missing, outdated, or incorrect records, leads to flawed insights and suboptimal decisions.
- Impact: Inaccurate demand forecasting, stock discrepancies, and ineffective replenishment strategies.
- Solution:
- Implement real-time inventory tracking tools like OneCart to ensure data accuracy across all platforms.
- Conduct regular data audits to identify and correct errors.
- Automate data entry processes to reduce human errors.
2. Resistance to Technology Adoption
- Challenge: Teams may resist adopting new inventory analytics tools due to a steep learning curve or fear of change.
- Impact: Limited use of analytics capabilities, leading to inefficient operations.
- Solution:
- Provide hands-on training and demonstrate the ROI of inventory analytics tools.
- Start with user-friendly platforms like OneCart, which simplify implementation and usage.
- Encourage adoption by highlighting time-saving features and error reduction.
3. High Implementation Costs
- Challenge: Advanced analytics tools and software often come with significant upfront and ongoing expenses.
- Impact: Smaller businesses may struggle to justify the investment.
- Solution:
- Start with scalable tools that offer affordable pricing plans, like OneCart.
- Focus on high-impact metrics (e.g., stockout rate, turnover ratio) to prioritize essential features.
- Leverage free or open-source tools for basic analytics until the business scales.
4. Integration with Existing Systems
- Challenge: Ensuring seamless integration between inventory analytics tools and existing ERP, CRM, or eCommerce platforms can be complex.
- Impact: Fragmented data, inefficiencies, and missed insights due to disconnected systems.
- Solution:
- Choose inventory analytics tools that offer robust integration capabilities, like APIs provided by OneCart.
- Work with IT teams to ensure compatibility and smooth data flow.
- Gradually phase in integrations to minimize disruptions.
5. Lack of Real-Time Visibility
- Challenge: Many businesses rely on manual inventory tracking or delayed updates, leading to a lack of real-time visibility.
- Impact: Stockouts, overstocking, and missed sales opportunities.
- Solution:
- Use real-time inventory management software to synchronize stock levels across channels.
- Automate alerts for low stock and reorder points.
- Monitor inventory dashboards regularly for immediate insights.
Steps to Implement Inventory Analytics in Your Business
Implementing inventory analytics involves strategic planning, the right tools, and a commitment to process improvement. Follow these actionable steps to integrate inventory analytics into your operations effectively.
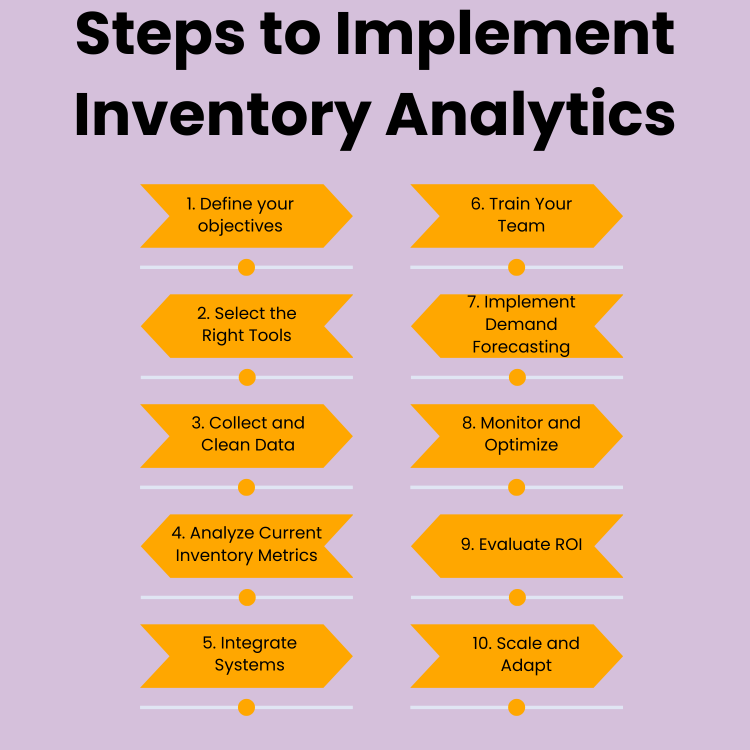
Step 1: Define Your Objectives
- What to Do:
- Identify your inventory management challenges (e.g., reducing stockouts, improving turnover, minimizing holding costs).
- Set measurable goals, such as reducing stockouts by 20% or increasing inventory turnover by 15%.
- Why It Matters:
- Clear objectives guide your analytics strategy and ensure alignment with overall business goals.
- Example Objective:
- “Improve demand forecasting accuracy to prevent seasonal stockouts during peak sales periods.”
- What to Do:
- Choose inventory management software that fits your business size and complexity.
- Ensure the tool offers features like real-time tracking, reporting, and predictive analytics.
- Consider scalability for future growth.
- Why It Matters:
- The right tools streamline data collection, analysis, and decision-making.
- Example Tool:
- OneCart offers real-time inventory syncing, sales trend analysis, and automated alerts for stock levels.
Step 3: Collect and Clean Data
- What to Do:
- Gather historical sales data, stock movement reports, and supplier performance records.
- Ensure the data is accurate, up-to-date, and free of duplicates or errors.
- Why It Matters:
- Clean data provides a reliable foundation for analytics and decision-making.
- Tips:
- Use automated tools to reduce manual errors in data entry.
- Regularly audit your data for consistency.
Step 4: Analyze Current Inventory Metrics
- What to Do:
- Calculate key metrics like turnover ratio, stockout rate, and GMROI.
- Segment inventory into categories (e.g., ABC analysis) to prioritize high-value items.
- Why It Matters:
- Understanding current performance highlights areas for improvement and helps set benchmarks.
- Example:
- Analyze slow-moving items to identify opportunities for clearance sales or promotions.
Step 5: Integrate Systems
- What to Do:
- Connect inventory analytics tools with existing systems like ERP, CRM, or eCommerce platforms.
- Ensure seamless data flow across all channels for real-time updates.
- Why It Matters:
- Integrated systems provide a holistic view of inventory and enable automated processes.
- Example Integration:
- Use OneCart to sync inventory data across Shopify, Lazada, and Amazon.
Step 6: Train Your Team
- What to Do:
- Provide hands-on training for employees on using inventory analytics tools.
- Educate staff on interpreting metrics and applying insights to operations.
- Why It Matters:
- Skilled teams maximize the value of analytics tools and drive better outcomes.
- Tips:
- Host regular workshops or webinars on best practices in inventory management.
Step 7: Implement Demand Forecasting
- What to Do:
- Use historical data and predictive models to forecast future demand.
- Account for variables like seasonality, promotions, and market trends.
- Why It Matters:
- Accurate forecasting minimizes stockouts and overstocking.
- Example:
- Forecast higher demand for summer products like air conditioners and fans, adjusting inventory accordingly.
Step 8: Monitor and Optimize
- What to Do:
- Regularly review inventory metrics and analytics dashboards.
- Identify trends, anomalies, and areas for improvement.
- Adjust strategies based on insights (e.g., increase safety stock for fast-selling items).
- Why It Matters:
- Continuous monitoring ensures that inventory analytics remains effective and aligned with business needs.
- Example:
- Monitor fill rates weekly to ensure on-time order fulfillment.
Step 9: Evaluate ROI
- What to Do:
- Measure the impact of inventory analytics on key performance indicators (KPIs) like reduced carrying costs or improved turnover rates.
- Assess whether the investment in tools and training has delivered measurable benefits.
- Why It Matters:
- Evaluating ROI ensures that resources are being used effectively and provides justification for further investment.
Step 10: Scale and Adapt
- What to Do:
- Expand your analytics capabilities as your business grows.
- Stay updated on new tools and techniques to refine your strategy.
- Why It Matters:
- Scalability ensures that your analytics processes evolve with market demands and business complexity.
- Example:
- Implement AI-driven analytics for more precise demand forecasting as your business handles larger datasets.
Frequently Asked Questions (FAQs)
1. What is inventory analytics, and why is it important?
Inventory analytics is the process of analyzing inventory data to optimize stock levels, reduce costs, and improve decision-making. It’s important because it helps businesses avoid stockouts and overstocking, forecast demand accurately, and streamline operations, ultimately boosting profitability.
2. How can inventory analytics prevent stockouts?
Inventory analytics uses real-time data, safety stock calculations, and demand forecasting to ensure stock levels align with customer demand. Tools like OneCart automate inventory tracking and alert businesses when stock is low, preventing stockouts.
The best tools include:
- OneCart: Real-time tracking, centralized order processing, and detailed reporting.
- ERP Systems (e.g., SAP, NetSuite): Comprehensive inventory and operations management.
- Spreadsheets (Excel, Google Sheets): For small-scale operations.
4. How does OneCart simplify inventory analytics?
OneCart simplifies inventory analytics by:
- Providing real-time stock updates across multiple sales channels.
- Offering detailed insights into sales trends, gross margins, and inventory performance.
- Automating reorder alerts and syncing inventory levels across platforms like Lazada, Shopee, and Shopify.
5. What are the core metrics in inventory analytics?
Key metrics include:
- Inventory Turnover Ratio: Tracks how often inventory is sold and replaced.
- Days Sales of Inventory (DSI): Measures how long it takes to sell inventory.
- Gross Margin Return on Investment (GMROI): Evaluates the profitability of inventory.
- Fill Rate: Indicates the percentage of orders fulfilled from available stock.
- Stockout Rate: Tracks how often products are unavailable.
Summary
Inventory analytics empowers businesses to optimize stock levels, reduce costs, and enhance efficiency by leveraging data-driven insights. It prevents stockouts, reduces overstocking, and improves customer satisfaction through real-time tracking and demand forecasting. Tools like OneCart simplify this process with centralized management, actionable reporting, and automated alerts, enabling businesses to make smarter decisions and drive profitability.
Ready to transform your inventory management? Discover how OneCart can help you streamline operations, reduce costs, and enhance customer satisfaction.
