Gross Margin vs Gross Profit: Formulas & Ecommerce Examples [2026] 2026
Learn the difference between gross margin and gross profit with clear formulas, ecommerce benchmarks by category, and real channel profitability examples.
Learn the difference between gross margin and gross profit with clear formulas, ecommerce benchmarks by category, and real channel profitability examples.
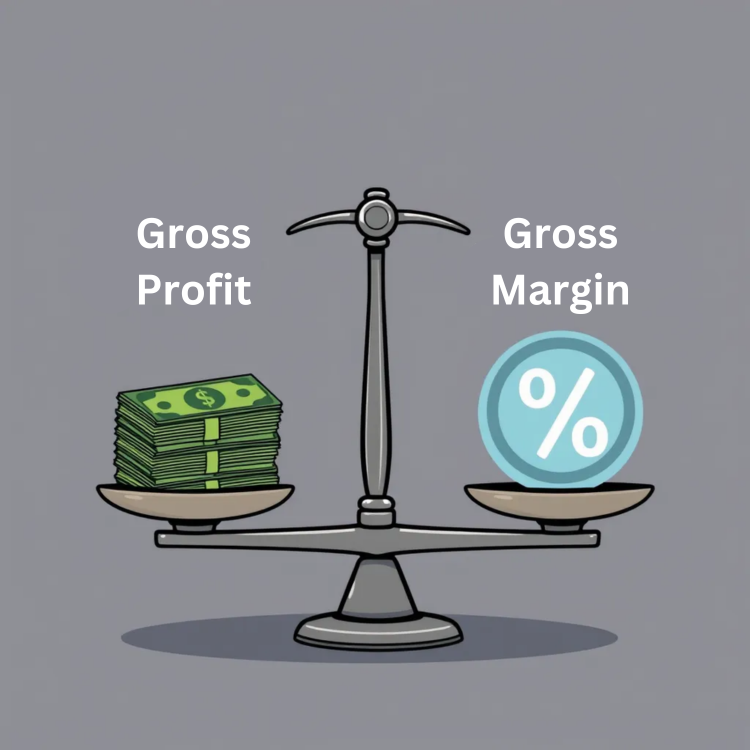
Gross margin and gross profit are not the same thing. Gross profit is the dollar amount left after subtracting cost of goods sold (COGS) from revenue. Gross margin expresses that same figure as a percentage. Confusing them leads to pricing mistakes that cost ecommerce sellers thousands — especially when selling across multiple marketplaces with different fee structures.
| Gross Profit | Gross Margin | |
|---|---|---|
| What it is | Dollar amount (Revenue − COGS) | Percentage ((Gross Profit ÷ Revenue) × 100) |
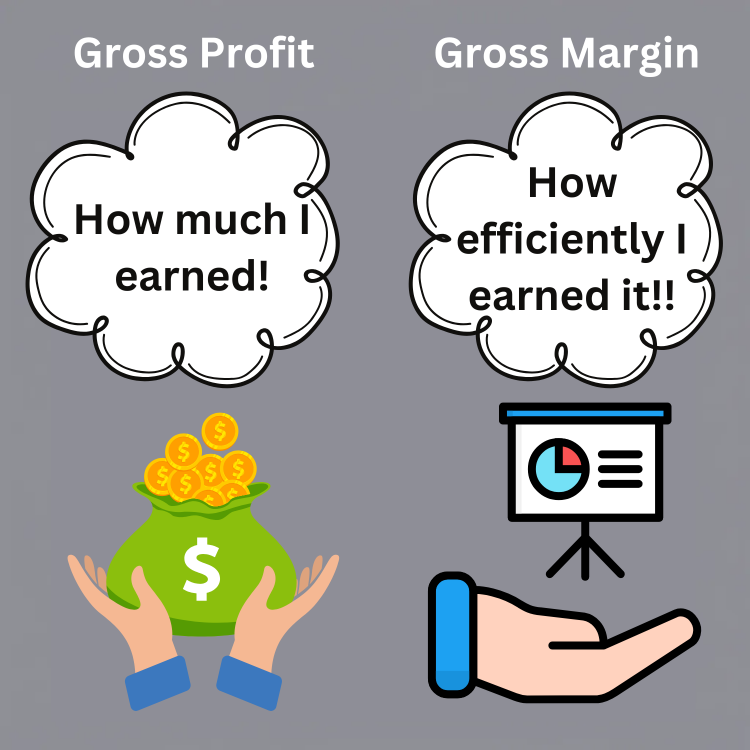
| Tells you | “How much” you earned above costs | “How efficiently” you earned it |
| Best for | Setting sales targets, cash planning | Comparing channels, products, time periods |
| Example | $20,000 on $50,000 revenue | 40% on $50,000 revenue |
This guide covers the formulas, real ecommerce benchmarks by category, a multichannel seller walkthrough across three platforms, and how to use both metrics to price profitably in 2026.
In 2026, multichannel sellers are dealing with rising platform fees (Shopee increased service fees across multiple markets in Q1), increasing logistics costs, and compressed margins. Knowing how to track and optimise both metrics is the difference between scaling profitably and growing into a loss.
Quick Insight: Gross profit tells you “how much” you earned above costs. Gross margin tells you “how efficiently” you earned it. You need both.
Gross profit is a fundamental financial metric that indicates the dollar value a business retains after subtracting the cost of goods sold (COGS) from its total revenue. It reflects the raw earning power of a business before accounting for other operational expenses, such as rent, marketing, and administrative costs.
Formula:
Gross Profit = Revenue − COGS
Gross profit is a direct indicator of how effectively a company is managing its production costs relative to its revenue. High gross profit suggests efficient cost management or strong sales performance, whereas low gross profit can signal inefficiencies or pricing challenges.
Imagine an ecommerce seller listing products on Shopee and their own Shopify store:
Gross Profit = 50,000 − 30,000 = $20,000
This $20,000 is what remains to cover operating expenses like warehouse rent, software subscriptions, staff salaries, and marketing spend.
Actionable Insight: For multichannel sellers, COGS should include marketplace commission fees. A product sold on Shopee incurs platform fees that don’t apply when sold via your own website. Track COGS per channel for accurate gross profit by platform — our free COGS calculator makes this straightforward.
Key Takeaway: Gross profit provides a snapshot of profitability but doesn’t account for operating or administrative expenses. For ecommerce sellers, make sure your COGS includes all platform-specific costs.
Gross margin is a percentage-based metric that expresses gross profit relative to total revenue. It demonstrates how efficiently a business is managing its costs to generate revenue. Unlike gross profit, which provides an absolute dollar amount, gross margin gives insight into profitability as a ratio, making it useful for comparisons across time periods, products, or industries.
Formula:
Gross Margin (%) = (Gross Profit / Revenue) × 100
Gross margin is a critical indicator of operational efficiency. A higher gross margin implies that a business retains more revenue after covering COGS, leaving more room for operating expenses and profits. It’s especially useful for benchmarking against competitors or tracking performance trends over time.
Using the same example as before:
Gross Margin (%) = (20,000 / 50,000) × 100 = 40%
This means that for every dollar earned in sales, the business retains 40 cents after covering COGS.
Key Takeaway: Gross margin is the metric that lets you compare apples to apples across channels, products, and time periods. It’s especially powerful for multichannel sellers managing different fee structures on each platform.
Gross margin and gross profit are closely related but serve distinct purposes in financial analysis. While both metrics originate from the same data—revenue and cost of goods sold (COGS)—their interpretations and applications differ significantly. Understanding these differences is essential for making informed decisions about pricing, cost management, and overall business strategy.
| Aspect | Gross Profit | Gross Margin |
|---|---|---|
| Definition | The dollar amount remaining after subtracting COGS from revenue. | The percentage of revenue retained after covering COGS. |
| Formula | Revenue - COGS | (Gross Profit ÷ Revenue) × 100 |
| Metric Type | Absolute value (dollars). | Relative value (percentage). |
| Use Cases | Evaluating overall profitability in monetary terms. | Comparing operational efficiency and cost management across products or periods. |
| Focus | “How much” a business earns above COGS. | “How efficiently” a business generates earnings above COGS. |
Using the earlier example:
Gross Profit tells us that the business has $20,000 left after covering production costs.
Gross Margin reveals that 40% of the revenue is retained as gross profit, offering a clearer view of efficiency.
Key Takeaway: Gross profit provides the “what,” while gross margin explains the “how well.” Use gross profit for absolute evaluations and gross margin for relative performance analysis.
One of the most common questions ecommerce sellers ask is “what’s a good gross margin?” The answer depends heavily on your product category, sales channels, and business model. Here are typical gross margin ranges for 2026:
| Category | Typical Gross Margin | Notes |
|---|---|---|
| Fashion & Apparel | 50-65% | Higher margins offset return rates (20-30%) |
| Electronics & Gadgets | 15-25% | Competitive pricing, thin margins, high volume |
| Beauty & Personal Care | 60-80% | Low production costs, strong brand premiums |
| Home & Kitchen | 40-55% | Mid-range, depends on sourcing |
| Food & Beverages | 30-50% | Perishability risk, cold chain costs |
| Digital Products | 70-90% | Near-zero COGS after creation |
| Handmade/Artisan | 55-70% | Labour-intensive but premium pricing |
Actionable Insight: These benchmarks assume direct-to-consumer sales. When selling through marketplaces like Shopee or Lazada, subtract 5-15% from these figures to account for commission and transaction fees. A fashion item with 60% margin on your website might drop to 45-50% on a marketplace.
For multichannel sellers, the biggest margin killer is often platform fees — not product costs. Here’s how fees stack up:
This is why tracking gross margin per channel matters. Your overall gross margin might look healthy at 45%, but if you break it down by platform, you might find Shopee at 38% and your own website at 55%. That gap is the core economic argument for adopting a D2C (direct-to-consumer) model alongside marketplace channels. This per-channel insight drives better inventory allocation and marketing decisions.
The difference between gross margin and gross profit becomes most obvious when you sell the same product across multiple platforms. Here’s a real scenario for a Bluetooth speaker selling at different price points on each channel:
| Channel | Gross Profit | Gross Margin | Verdict |
|---|---|---|---|
| Own Store | $29.45 | 59.0% | Highest profit AND margin |
| Shopee | $26.94 | 58.7% | Lower profit, nearly same margin (lower price = lower fees) |
| Amazon FBA | $28.47 | 53.8% | Middle profit, lowest margin (FBA fees add up) |
If you only tracked gross profit, you’d think your own store and Amazon are roughly equal ($29.45 vs $28.47). But gross margin reveals that Amazon is 5.2 percentage points less efficient — meaning you keep less of every dollar earned. At scale, that gap compounds: selling 1,000 units on Amazon leaves you $980 worse off than your own store ($29,450 vs $28,470 in gross profit).
This is why multichannel sellers need to track both metrics per channel. Use our profit margin calculator to model these scenarios for your products, and our break-even calculator to find the minimum volume you need on each platform.
While gross profit and gross margin focus on a business’s revenue after covering the cost of goods sold (COGS), net profit and net profit margin take the analysis a step further by accounting for all other expenses. These include operating costs, taxes, interest, and other financial obligations.
Net Profit: The total profit left after deducting all expenses from revenue, including operating costs, interest, and taxes.
Net Profit = Gross Profit − Operating Expenses − Taxes − Interest
Net Profit Margin: The percentage of revenue that remains as net profit after all expenses.
Net Profit Margin (%) = (Net Profit / Revenue) × 100
| Aspect | Gross Profit/Margin | Net Profit/Margin |
|---|---|---|
| Definition | Focuses on revenue after covering COGS. | Accounts for all expenses beyond COGS. |
| Scope | Limited to production and direct costs. | Comprehensive view of overall profitability. |
| Use Cases | Evaluating operational efficiency. | Assessing total financial health. |
Using the same example:
Net Profit:
Net Profit = 20,000 − 10,000 − 2,000 = 8,000
Net Profit Margin:
Net Profit Margin (%) = (8,000 / 50,000) × 100 = 16%
This means the business retains 16 cents in profit for every dollar of revenue, after accounting for all costs.
Key Takeaway: Gross metrics highlight operational efficiency, while net metrics provide a full picture of financial health.
Gross margin and gross profit are powerful metrics that provide different perspectives on a business’s financial performance. When used together, they offer actionable insights to guide strategic decisions and optimize profitability.
Example Decision: A multichannel seller notices declining gross profit despite steady sales volume. After reviewing inventory turnover data, they find that rising shipping costs and a Shopee commission increase are eating into margins. They adjust pricing on marketplace channels and push more traffic to their own Shopify store.
Example Decision: An ecommerce seller discovers that skincare products have a 65% gross margin, while phone accessories have only 18%. They shift ad spend toward skincare and consider whether phone accessories are worth listing on high-fee marketplaces at all. A markup calculator helps them set minimum prices per channel.
Example Decision: A seller listing electronics on multiple platforms compares gross margins across Lazada and TikTok Shop. Lazada’s higher commission rate is compressing margins on low-ticket items, so they shift those products to TikTok Shop where fees are lower for their category.
Example Decision: An ecommerce brand benchmarks its gross margin against category averages (see benchmarks above) and finds it’s 15% below peers. After analysing their margin vs markup calculations, they discover their pricing hasn’t been adjusted to account for recent shipping cost increases.
Example Decision: A multichannel store identifies that beauty products, with a 65% gross margin, drive the bulk of profits across all channels. They use inventory management tools to ensure these high-margin SKUs are always in stock and prioritise them in advertising campaigns.
Example Decision: A multichannel seller with stable 55% gross margins decides to expand from Shopee Singapore into Shopee Malaysia and TikTok Shop. They model the expected margin per platform using landed cost calculations for cross-border shipping and local fee structures. The margin analysis shows TikTok Shop MY will maintain 48% margin, confirming the expansion is sustainable.
Key Takeaway: Gross profit tells you how much money your business generates, while gross margin reveals how efficiently it generates that money. Together, they provide a roadmap for making informed, strategic decisions. Read our article on Top Ecommerce Metrics for more information.

For ecommerce sellers operating across multiple platforms, gross margin analysis becomes significantly more complex — and more important. Each sales channel has its own fee structure, fulfilment costs, and customer acquisition costs that affect your COGS differently.
The most impactful habit you can build is tracking gross margin per channel, not just overall. Here’s why:
A product that is profitable on your own store might be loss-making on a high-fee marketplace. Without per-channel margin tracking, you won’t know until it’s too late.
Modern multichannel sellers use several approaches to protect margins:
Actionable Insight: If you sell on 3+ marketplaces, centralised inventory and pricing management tools like OneCart can help you track margin per channel and adjust pricing without manually updating each platform.
Despite being fundamental financial metrics, gross margin and gross profit are often misunderstood. These misconceptions can lead to misinformed business decisions, inefficiencies, and missed opportunities.
Example: A company with $200,000 gross profit on $1,000,000 revenue has a gross margin of 20%. Knowing both metrics helps contextualize profitability in terms of scale and efficiency.
Example: An ecommerce seller on multiple marketplaces generates $500,000 in gross profit, but spends $200,000 on advertising across Shopee, Lazada, and Google, plus $150,000 on warehouse rent, $180,000 on staff, and $50,000 on software subscriptions. That’s $580,000 in operating expenses — a net loss despite strong gross profit.
Example: A solo seller running a Shopee store with 50 SKUs uses gross margin to identify that their accessories category runs at 22% margin — well below the 40-55% benchmark for home goods. They renegotiate with their supplier or adjust pricing to fix it.
Example: An ecommerce seller switches to a cheaper supplier to push gross margin from 45% to 55%. Return rates jump from 5% to 18%, and Shopee’s return penalty eats into both margin and seller rating. The margin gain on paper disappears in practice. Track sell-through rate alongside margin to catch this early.
Example: A multichannel ecommerce business has 60% gross margin across all channels. But after deducting warehouse rent, marketing spend, software subscriptions, and returns processing, net profit is just 5%. Focusing only on gross margin would miss that the business is one bad quarter away from loss. Use a break-even calculator to understand how much revenue you truly need.
Example: A marketing team uses gross margin by channel to decide where to allocate ad spend (high-margin channels get more budget). The operations team uses gross profit to plan inventory reorder points — ensuring high-profit products don’t go out of stock while low-profit items aren’t over-ordered.
Key Takeaway: Understanding the distinctions and limitations of gross profit and gross margin ensures accurate analysis and better decision-making. Avoiding these misconceptions allows businesses to leverage these metrics effectively.
No, gross margin and gross profit are different. Gross profit is the dollar amount remaining after subtracting the cost of goods sold (COGS) from revenue, while gross margin is that amount expressed as a percentage of revenue.
Both are important but serve different purposes:
Gross margin focuses on revenue after covering COGS, while net margin accounts for all expenses, including operating costs, taxes, and interest. Net margin reflects the overall profitability of a business.
Generally, yes, as it indicates better efficiency in managing costs relative to revenue. However, excessively cutting costs to boost gross margin can harm product quality or customer satisfaction, so balance is key.
Yes, a business with high gross profit can still have low net profit if operating expenses, taxes, or other costs are too high. For example, a business with $100,000 in gross profit but $95,000 in expenses would only have $5,000 in net profit.
Gross margin helps businesses evaluate how pricing impacts profitability. It ensures that products are priced to cover costs while maintaining a healthy profit percentage.
Gross margin only accounts for the cost of goods sold (COGS) — product costs, shipping, packaging, and marketplace fees. Profit margin (or net profit margin) goes further by also subtracting operating expenses, marketing costs, taxes, and interest. A seller can have a strong 55% gross margin but a thin 5% net profit margin if operating costs are high. Gross margin measures production efficiency; profit margin measures overall business health.
Industries like software, pharmaceuticals, and luxury goods often have high gross margins due to lower production costs or premium pricing. However, industries with high COGS, such as manufacturing or retail, typically have lower margins.
Gross profit and gross margin are essential metrics for understanding and improving a business’s financial performance — particularly for ecommerce sellers managing products across multiple platforms in 2026. While gross profit shows the dollar value earned above COGS, gross margin reveals the efficiency of those earnings as a percentage. Together, they help you compare profitability across channels, set accurate pricing per marketplace, and make data-driven decisions about inventory allocation and growth.
The key for multichannel sellers: track both metrics per channel, not just overall. Different marketplace fee structures mean the same product can have vastly different margins on Shopee vs Lazada vs your own website. Use the category benchmarks above to gauge where you stand, and the fee calculators to understand your true per-platform COGS.
Selling across Shopee, Lazada, TikTok Shop, Amazon, or Shopify? OneCart helps multichannel sellers sync inventory, track profitability per channel, and manage pricing across all platforms from one dashboard. Start your free trial today.
OneCart unifies inventory, orders and listings across 20+ marketplaces — Shopee, Lazada, TikTok Shop, Shopify, Amazon and more.
Try OneCart freeUsed by hundreds of merchants in Singapore & Southeast Asia